Lab: Interpreting and Matching
Displacement vs. Time Motion Graphs
Objectives:
Materials:
TI-84 Calculator-Based Lab Unit (CBL-II)
Motion detector
Meter stick
Computer with LoggerPro software
Procedure:
Part I –
1. Develop a position vs. time story that describes a body in motion incorporating at least the following four types of motion.
i. standing still
ii. moving with constant velocity
iii. moving with variable negative velocity
iv. moving with variable positive velocity
2. Illustrate the story on a position vs. time graph. Use a legend to cross reference sections of the graph with the corresponding sections of the story.
3. Underneath the graph, write instructions for moving in front of the motion detector according to the graph you have drawn (see page 2 for example).
Part II – AT THE LAB STATION IN CLASS WITH A PARTNER
4. Measure out and mark meaningful locations on the floor and practice the motion needed to create the position vs. time graph.
5. Now it’s time for you to match your physical motion to your group’s descriptive motion graph. You have 3 attempts to match it as best you can. Save a copy best graph your motion creates and reproduce this graph using LoggerPro.
DATA- story, instructions, Illustrated graph, motion detector graph & data
Data Analysis: Discuss differences between the descriptive graph and the graph generated by the motion detector. What are the reasons for the differences?
Conclusion: Develop a conclusion that addresses the objectives of the lab.
Displacement vs. Time Motion Graphs
Objectives:
- Create a Displacement vs. Time graph and match your graph with actual motion.
- Gain competence in the use of motion detector and related equipment.
- Understand the relationship between position vs. time, velocity and acceleration.
Materials:
TI-84 Calculator-Based Lab Unit (CBL-II)
Motion detector
Meter stick
Computer with LoggerPro software
Procedure:
Part I –
1. Develop a position vs. time story that describes a body in motion incorporating at least the following four types of motion.
i. standing still
ii. moving with constant velocity
iii. moving with variable negative velocity
iv. moving with variable positive velocity
2. Illustrate the story on a position vs. time graph. Use a legend to cross reference sections of the graph with the corresponding sections of the story.
3. Underneath the graph, write instructions for moving in front of the motion detector according to the graph you have drawn (see page 2 for example).
Part II – AT THE LAB STATION IN CLASS WITH A PARTNER
4. Measure out and mark meaningful locations on the floor and practice the motion needed to create the position vs. time graph.
5. Now it’s time for you to match your physical motion to your group’s descriptive motion graph. You have 3 attempts to match it as best you can. Save a copy best graph your motion creates and reproduce this graph using LoggerPro.
DATA- story, instructions, Illustrated graph, motion detector graph & data
Data Analysis: Discuss differences between the descriptive graph and the graph generated by the motion detector. What are the reasons for the differences?
Conclusion: Develop a conclusion that addresses the objectives of the lab.
Data
Greg decides to walk to the store. He start at a constant velocity of .5 m/sec for the first 4 sec. He then reaches some stairs, which he walks up at a velocity of 1 m/sec for 10 sec. He falls and accelerates down the stairs at 1m/sec^2 for 4 sec. After he hits the bottom, he instantaneously stops, but somehow doesn’t die from the massive amount of g-force that is then applied to him. He lies on the ground and holds his knee for 3 sec as he says “Ssssssshhhh-ahhhhh” repeatedly. He then gets up and attempts to sprint up the stairs a second time at a velocity of 1.5 m/sec for 4 sec. He then trips again, but this time he trips up the stairs and accelerates at a speed of .5 m/sec^2 for 4 sec. He then accelerates down the stairs at 1 m/sec^2 until he reaches the bottom, 4 sec later.
Greg decides to walk to the store. He start at a constant velocity of .5 m/sec for the first 4 sec. He then reaches some stairs, which he walks up at a velocity of 1 m/sec for 10 sec. He falls and accelerates down the stairs at 1m/sec^2 for 4 sec. After he hits the bottom, he instantaneously stops, but somehow doesn’t die from the massive amount of g-force that is then applied to him. He lies on the ground and holds his knee for 3 sec as he says “Ssssssshhhh-ahhhhh” repeatedly. He then gets up and attempts to sprint up the stairs a second time at a velocity of 1.5 m/sec for 4 sec. He then trips again, but this time he trips up the stairs and accelerates at a speed of .5 m/sec^2 for 4 sec. He then accelerates down the stairs at 1 m/sec^2 until he reaches the bottom, 4 sec later.
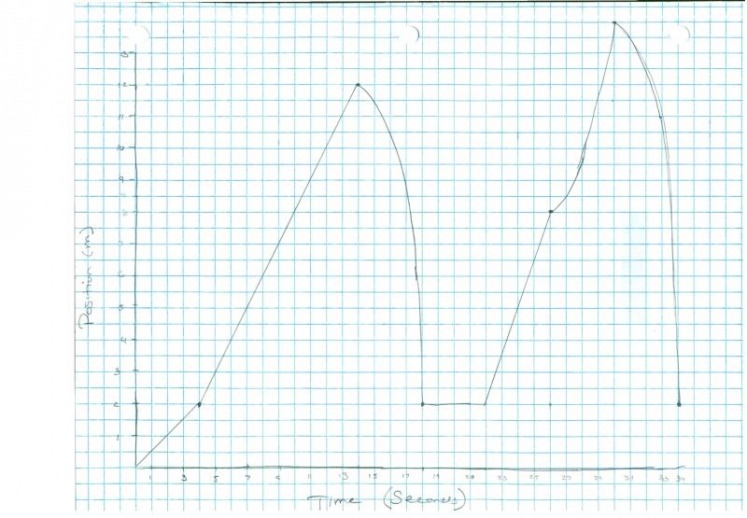
Illustrated Graph
Instructions To recreate Graph:
a. Stand in front of the motion detector, about .5m away holding a book about 10 cm away from it
b. Bring the book to your chest slowly, then walk backwards at a about .5 m/sec for 2 m then stop.
c. Walk toward detector while slowly speeding up, stopping .5 m away.
d. Stand still for about a second
e. walk away from detector for 1 m at .75 m/sec
f. speed up and then stop at a distance 2 m away from the detector
g. speed up towards the detector at a constant acceleration and stop .5 m from the detector
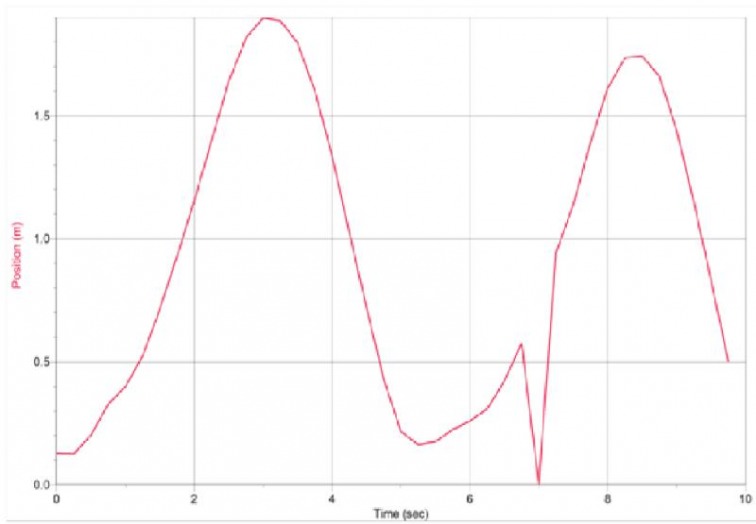
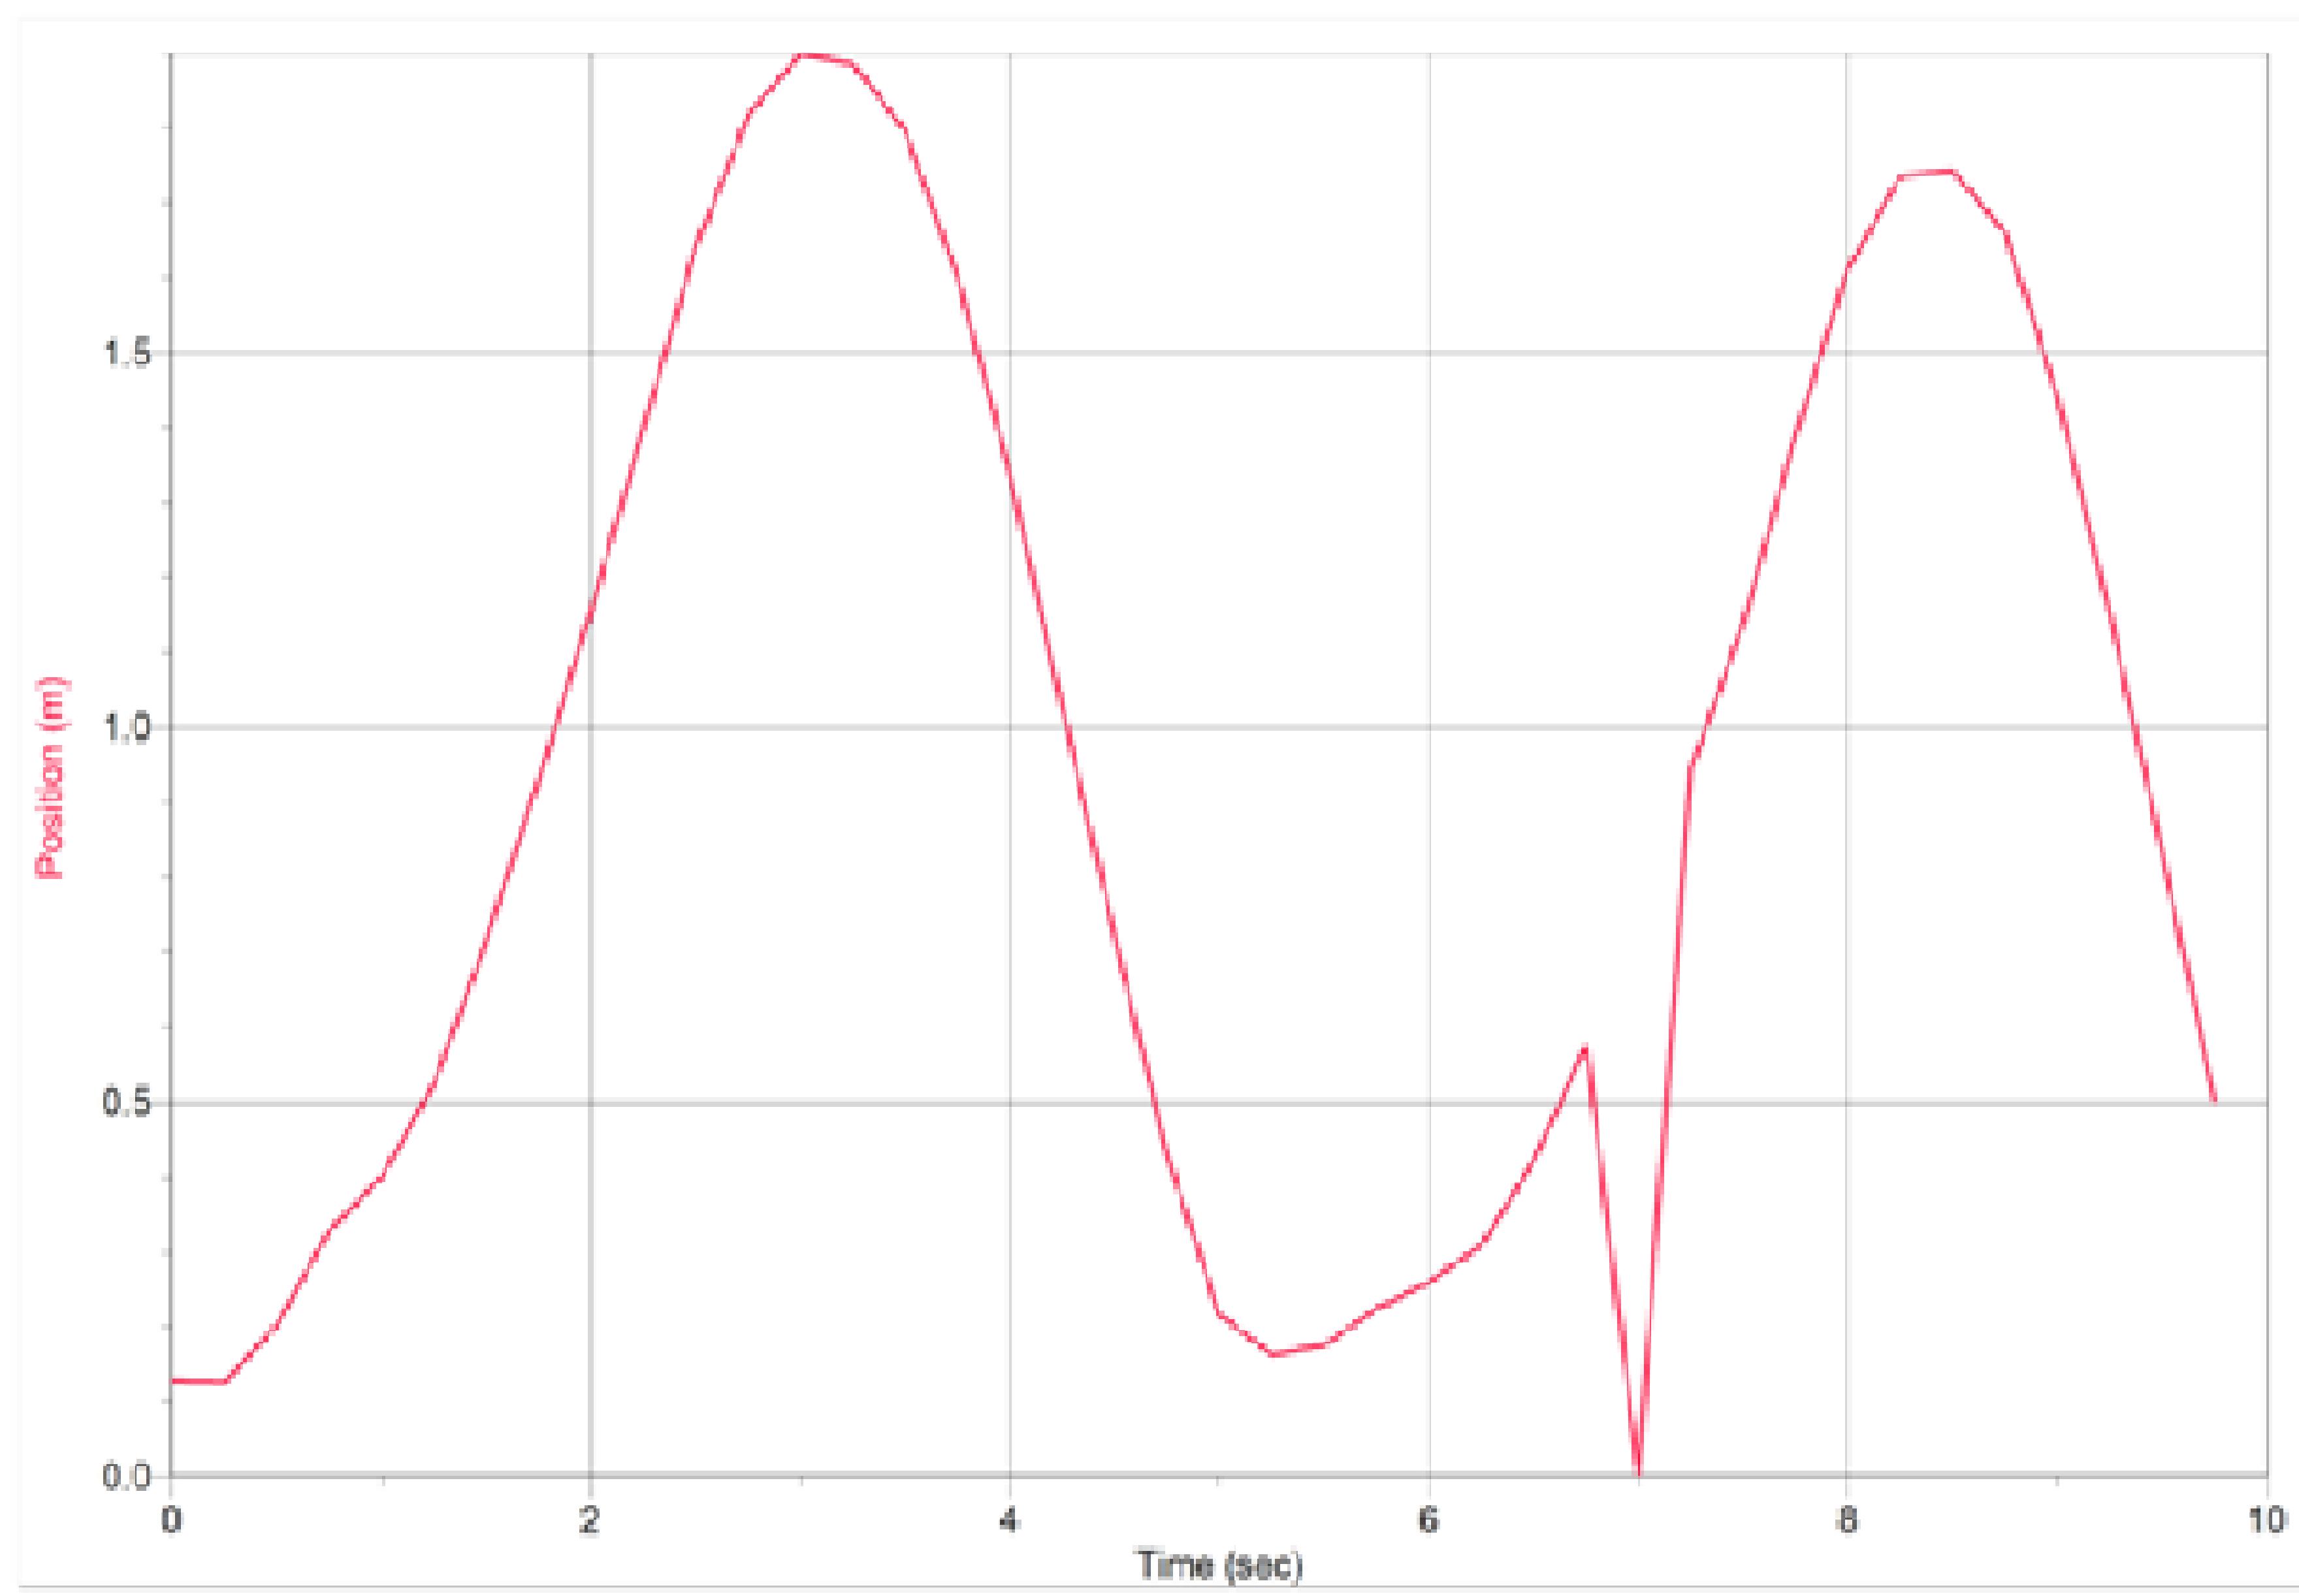
Motion Sensor Graph
| Excel Motion Lab Data |
Data Analysis
Discuss differences between the descriptive graph and the graph generated by the motion detector. What are the reasons for the differences?
The graph from the motion detector is very similar to the illustrated graph that we made from the story. There are two major discrepancies between the two graphs though. The first is that there is no point on the motion detector graph where there is a velocity of 0 m/s compared to the illustrated graph. It is most likely due to the inability of the person who is moving to remain completely still for the length of time needed to get the plateau. The next discrepancy is the major dip at around the 7 sec mark on the motion detector graph. This is most likely due to an error in the motion detector itself because it shows that our tester suddenly appeared right in front of the motion detector, then appeared even farther away from it. But if you were to take out the dip, and connected the graph, you would be able to see that there is a somewhat constant velocity away from the motion detector.
Conclusion
We were fairly competent while using the motion detector during this lab. It took us a few tries until we were able to get a graph that was at least fairly similar to the one that we drew for our story. While using the motion detector though, we had several equipment malfunctions. Before we got our final graph the motion detector would spike whenever our tester moved before resuming the actual position. The graph showed our tester teleporting all over the place, which was very strange. Our final graph still had one of these spikes, in this case a huge drop, but we considered it good enough to use. Using the position vs. time graph we are able to find several things, including position at a certain time, the average velocity over a period of time, as well as the instantaneous velocity at a single point of time. Acceleration is difficult to find with the position vs. time graph, but using a velocity vs. time graph it is much easier as acceleration is to velocity, as velocity is to position.
| Motion Lab |
| Illustrated Graph |
| Motion Detector Graph |
| Motion Lab Data |
